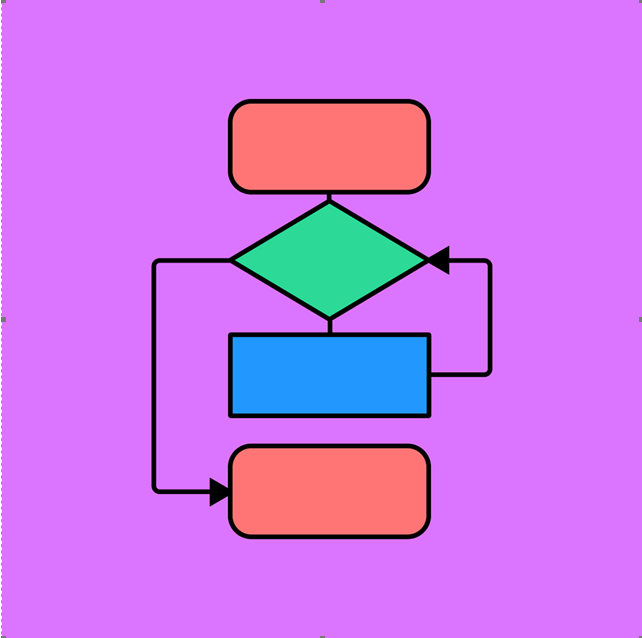
Significance of Flow Charts in MES Planning
Flowcharts outline each manufacturing process step, making it easier to visualize how different stages connect. This is crucial for MES design, as it helps identify key production steps, dependencies, and interactions between various operations, such as raw material intake, production, quality control, and distribution.
2. Identifying Bottlenecks and Inefficiencies
Flowcharts detail each step in production, quality control activities, and logistics flow, allowing the design team to identify potential bottlenecks, redundancies, and inefficiencies. This enables early optimization, reducing downtime and improving the overall efficiency of the MES.
3. Defining Data Collection Points
Defining data points in MES systems is essential. A well-developed flowchart accurately shows data collection points in the production process. Flowcharts help identify where data needs to be collected and integrated, such as at quality checkpoints, equipment status updates, and production yield metrics, ensuring comprehensive monitoring. Moreover, flowcharts illustrate how data moves from one point to another.
4. Supporting Communication and Collaboration
Flowcharts are easy to understand and can be used to communicate the project design to all stakeholders, including those outside of IT. This ensures that everyone shares a common understanding of the project goals and design, which is critical for gaining buy-in and feedback from both technical and non-technical team members.
5. Documenting Requirements and Functional Specifications
Flowcharts are valuable for documenting and conveying the functional requirements of an MES. By visually representing each process, they help define what each part of the system should do and identify where specific MES functionalities, such as tracking, data capture, and reporting, are needed.
6. Facilitating System Integration
MES projects often involve integration with other systems (e.g., ERP, SCADA, Quality Management Systems). Flowcharts allow designers to visualize these integration points and clarify data flows between systems, ensuring smooth interoperability.
Types of Flowcharts
There can more several flow charts that can be developed on a need basis. However, there are a few examples described as under:
1. Process Flow Chart: Displays the sequence of manufacturing or process steps, including main processes and associated sub-processes.
2. Data Flow Chart: Details the data generated at each process step and its relationship with other process points.
3. Manpower Flow Chart: Illustrates the manpower utilized at each process step, their interaction with other steps, and their movement across multiple tasks.
4. Organisation Flow Chart: Gives the details of manpower engaged/involved in the MES project including hierarchal positions and interaction with each other.


Please sign in or register for FREE
If you are a registered user on The FSQ Network, please sign in